I like reading and use Goodreads to help me keep track of books I’ve read. Goodreads gives you a year-end summary, which is great, but it only shows up in December. I wanted something I could generate any time that looked at the last twelve months, regardless of time of year.
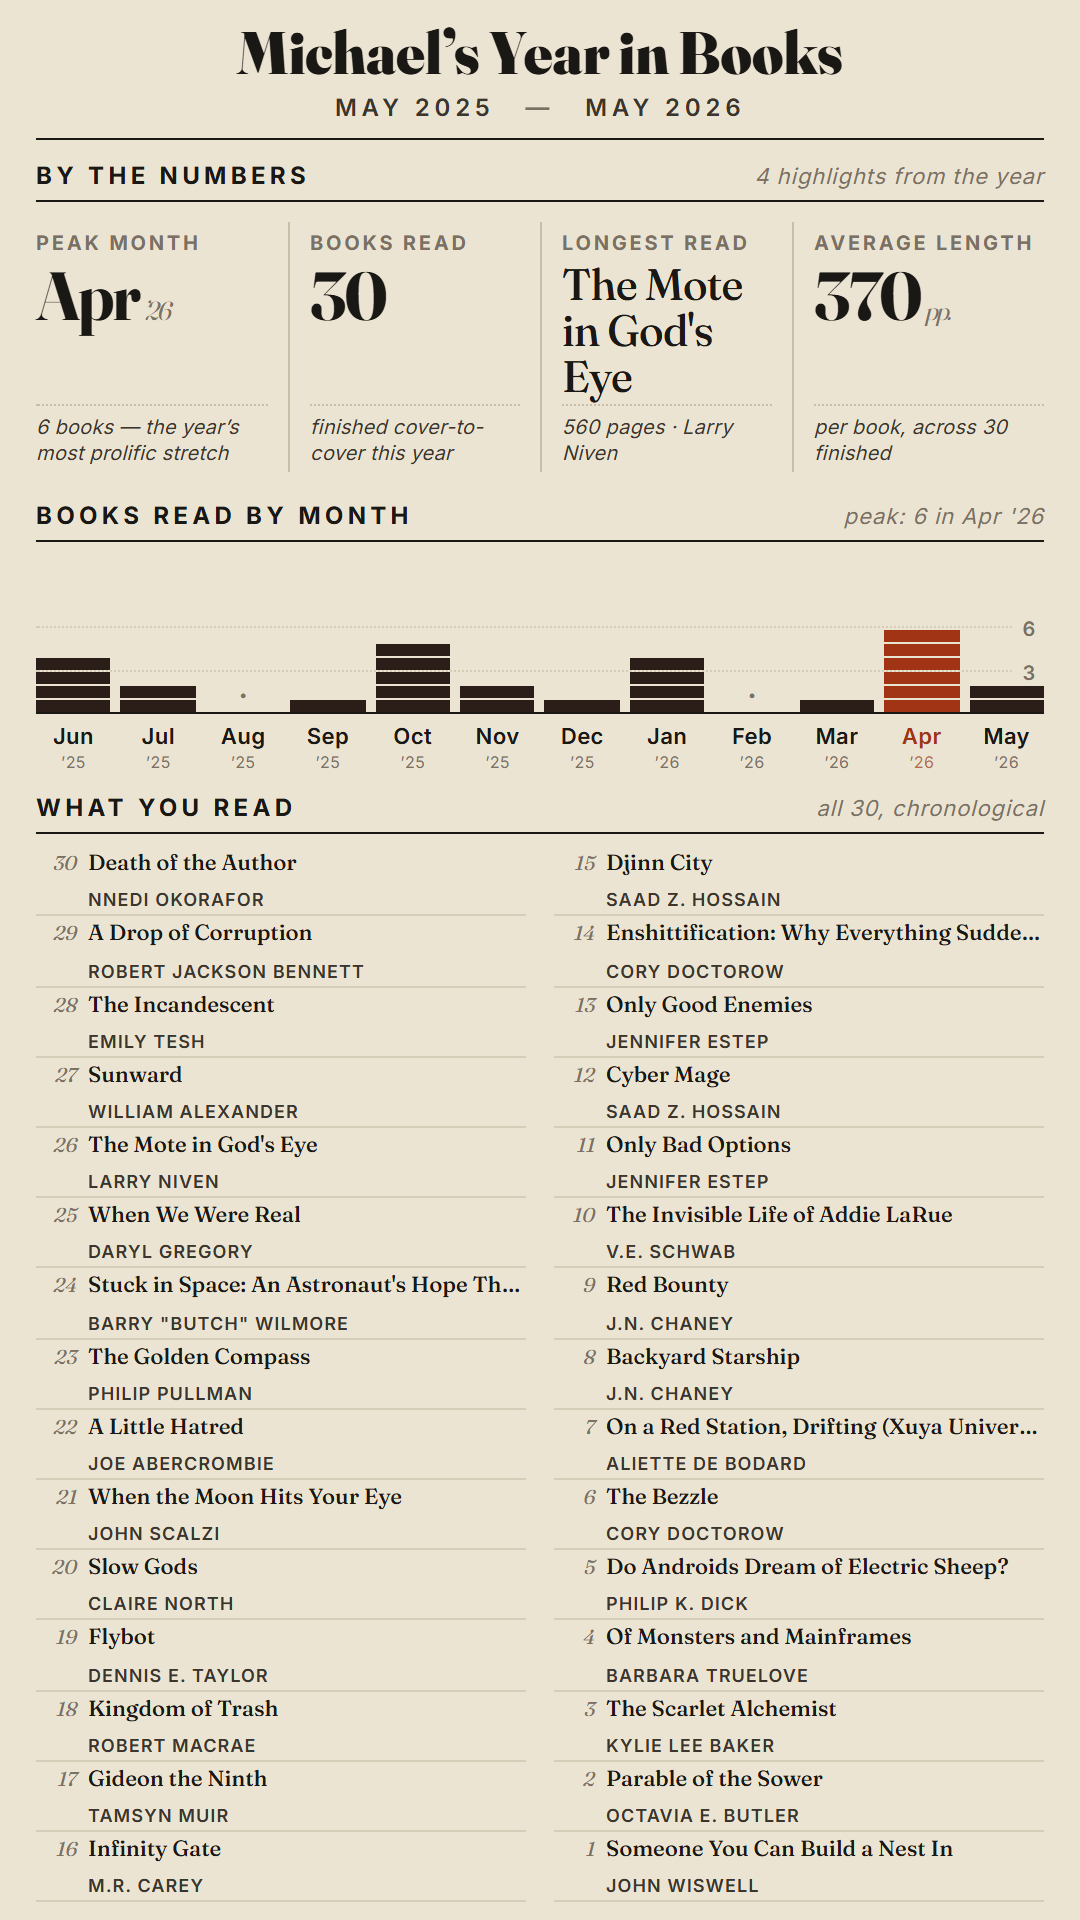
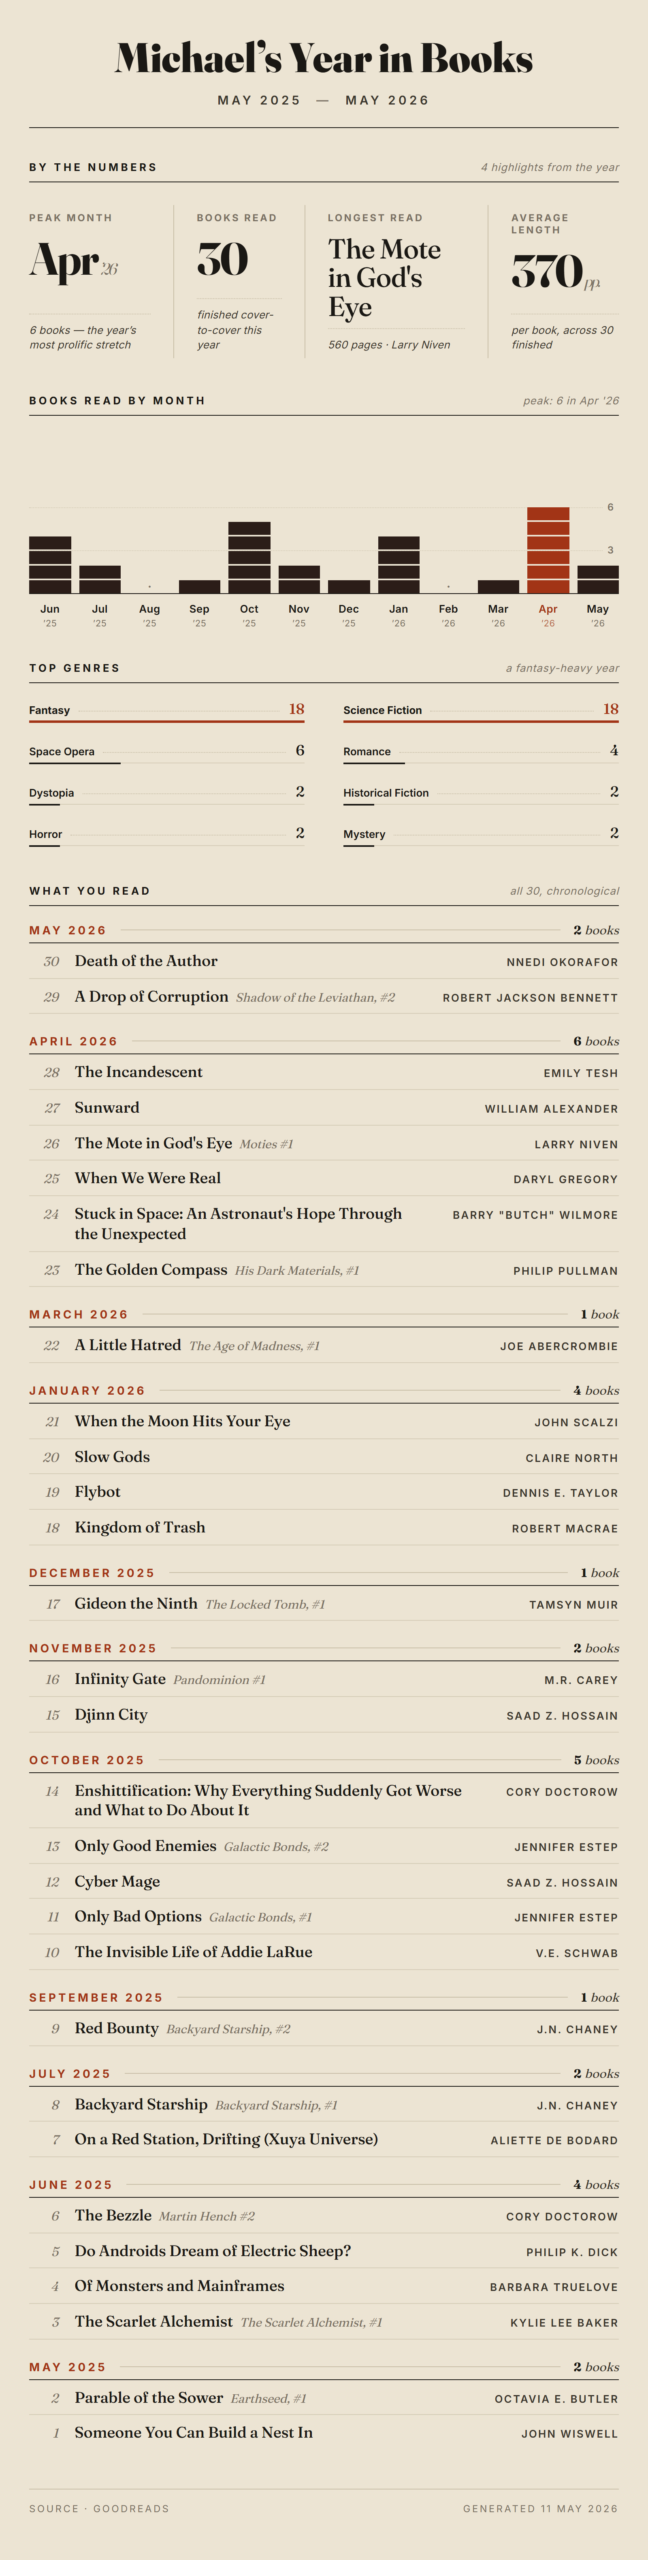
So I built Year in Books, a new feature in my goodreads-tools project. It pulls your Goodreads read shelf via RSS, windows the last 12 months on a rolling basis, looks up genres through the Google Books API, and renders everything into nice graphics.
The output comes in four flavors: straight HTML, a PDF, a full-width web PNG, and a 9:16 social media PNG sized for Instagram, Bluesky, or Mastodon. HTML is generated and rendered into the PDF and PNGs. There’s a simple web UI to download the various versions.
For my kind of brain, these kinds of stats are interesting. I can see how my reading lines up with other events in my life.
This layout is what I like, but the code is here to modify as you might see fit:
https://github.com/cruftbox/goodreads-tools